Search
There are 5 results.
Tag
Tag
All (71)
Active Learning (2)
Activities (1)
Alt Text (2)
Analytics (1)
Animations (1)
Assessments (3)
Asynchrony (3)
Backwards Design (1)
Belonging (3)
Canvas (3)
Collaboration (2)
Color Contrast (2)
Communication (6)
Community (3)
Content Creation (10)
Copyright (2)
Course Maintenance (5)
Course Materials (7)
Course Preparation (4)
Discussions (1)
Diversity (4)
Equity (2)
Faculty Presence (2)
Faculty Support (1)
Feedback (1)
Game-Based Learning (2)
Gamification (1)
Hyperlinks (1)
Images (3)
Inclusion (6)
Infographics (2)
Learning Objectives (2)
Multimodality (3)
Page Design (2)
Podcasts (1)
PowerPoint (2)
Presentations (1)
Qualitative courses (1)
Quantitative courses (1)
Representation (1)
Revising (2)
Rubrics (2)
Screen Readers (1)
Social Media (1)
Summative Assessments (1)
Synchrony (4)
Third-Party Tools (1)
Universal Design for Learning (UDL) (2)
Video (12)
Visual Accessibility (2)
Visual Design (2)
Quizzes for the Multimodal Course
From trivia games to final exams, quizzing tools have a variety of uses for learning as well as assessment. Exams and quizzes have a particularly plentiful range of possibilities in a multimodal or hybrid course, where they can be administered synchronously or asynchronously. Research suggests that the presentation of a tool influences student behavior in response to the tool. In comparing two student discussion boards, one an ungraded discussion and one a graded replacement for a final exam, Cheng et al. (2013) found that students displayed more knowledge on the graded board, but more evidence of learning on the ungraded board. The students who participated in the study were more likely to grapple with new ideas when the stakes were low, but more eager to showcase topics they were confident about when their responses would have a greater impact on their grades. When considering quizzing tools, then, we recommend allowing your course goals to guide your usage.
Infographic Considerations
An infographic is a visual that combines text, graphics, diagrams, and graphs to present information. When used effectively, infographics can be a powerful tool to guide students through the learning process. “Infographics ask for an active response from the viewer, raising the questions, ‘What am I seeing?’ and ‘What does it mean?’” (Krauss, 2012, p. 10). Infographics also present information in an organized way, which can improve students’ critical thinking, analysis, and synthesis skills (Yildirim, 2016).
Game-Based Learning Experiences
Game-based learning (GBL) is a learning experience, or set of learning experiences, delivered through gameplay or game-like activities with defined learning outcomes. GBL is often confused with gamification, which is the application of game elements to a non-gaming experience. GBL engages students cognitively, emotionally, behaviorally, and socioculturally (Plass et al., 2015). Many factors should be considered when designing GBL, including narrative, player positioning, and interactive design (Dickey, 2005).
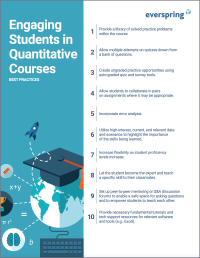
Enhancing Quantitative Courses With Varied Learning Approaches
Employing a variety of modes of instruction and assessment, as recommended by Universal Design for Learning (UDL) principles, can enhance the learning experience for students in quantitative courses. Diverse elements such as visual aids, interactive features, and real-world applications can complement, extend, or replace traditional lectures and exams. Since classes consist of students with varying learning preferences and strategies, using multiple modes of representation in a course promotes deeper understanding, engagement, and skill development. This piece details design elements that can be particularly impactful in quantitative courses.


