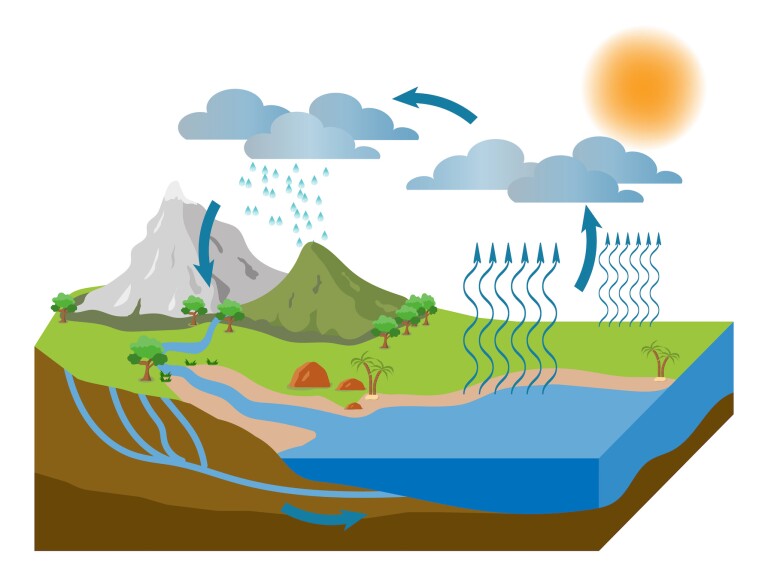
An infographic is a visual that combines text, graphics, diagrams, and graphs to present information. When used effectively, infographics can be a powerful tool to guide students through the learning process. As described by Krauss (2012), “Infographics ask for an active response from the viewer, raising the questions, ‘What am I seeing?’ and ‘What does it mean?’” (p. 10). Infographics also present information in an organized way, which can improve students’ critical thinking, analysis, and synthesis skills (Yildirim, 2016).
There are many potential applications for infographics in online courses. An infographic may be used to provide a snapshot or overview of information for students at the beginning of a lecture. It may also illustrate patterns in a dataset, helping students make connections between discrete bits of information. Infographics may also be used to make a block of text more interesting and engaging for students. For instance, a bulleted list of the qualities needed in a social worker can be transformed into an infographic that is more visually interesting to the viewer.
Design Guidelines
When creating or selecting an infographic, keep the following guidelines in mind:
- Only include the most critical information that should be learned about the subject of the infographic (Yildirim, 2016).
- Use images thoughtfully, as decorative images may cause unnecessary cognitive load (Yildirim, 2016).
- Only include reliable and timely sources of data and information (Krauss, 2012).
- Use color to draw attention to key components of an infographic, but be careful not to overwhelm the viewer with too many colors. To maximize accessibility, provide an alternate way to differentiate information that is color-coded, such as bolding.
- Ensure that all informative visual information conveyed in the graphic is provided in an alternate format, such as text.
There are many online tools that can be used to create an infographic, including Adobe Spark, Piktochart, and Venngage. To learn more about creating infographics, review the following resources:
- How to Make an Infographic in Under 1 Hour | Easy Guide (2024)
- The Do’s and Don’ts of Infographic Design
- 12 Great Infographics for Education Plus Templates
References
Krauss, J. (2012). Infographics: More than words can say. Learning & Leading with Technology, 39(5), 10–14.
Yildirim, S. (2016). Infographics for educational purposes: Their structure, properties and reader approaches. The Turkish Online Journal of Educational Technology, 15(3), 98–110.

